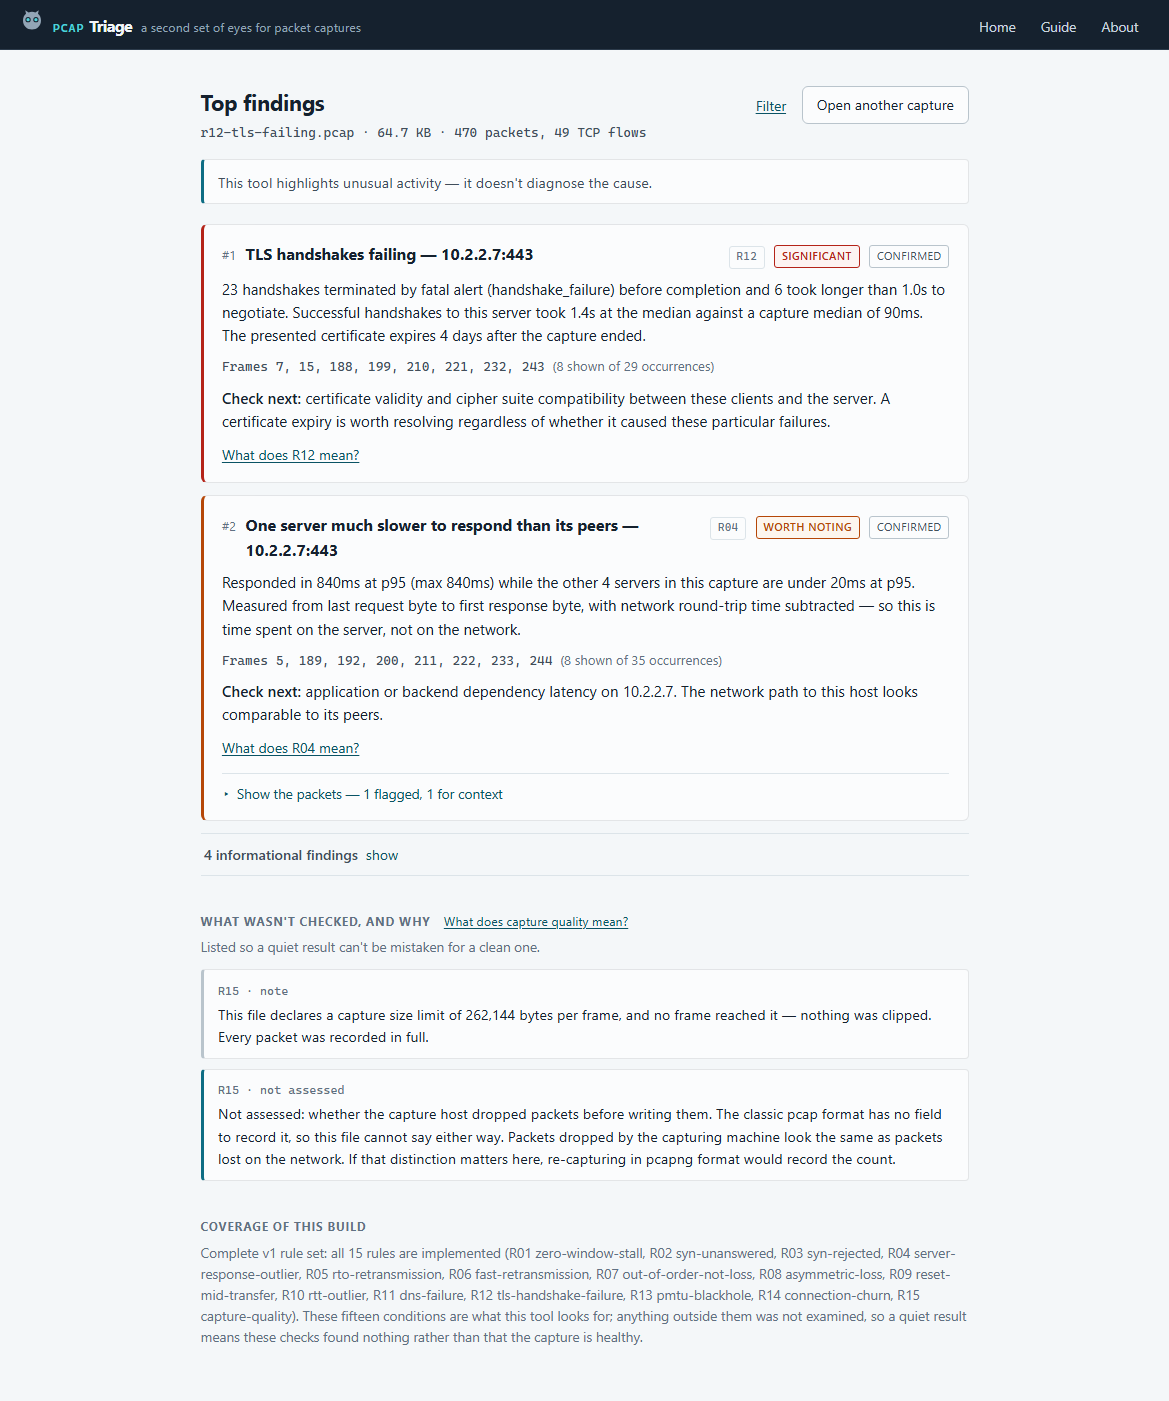
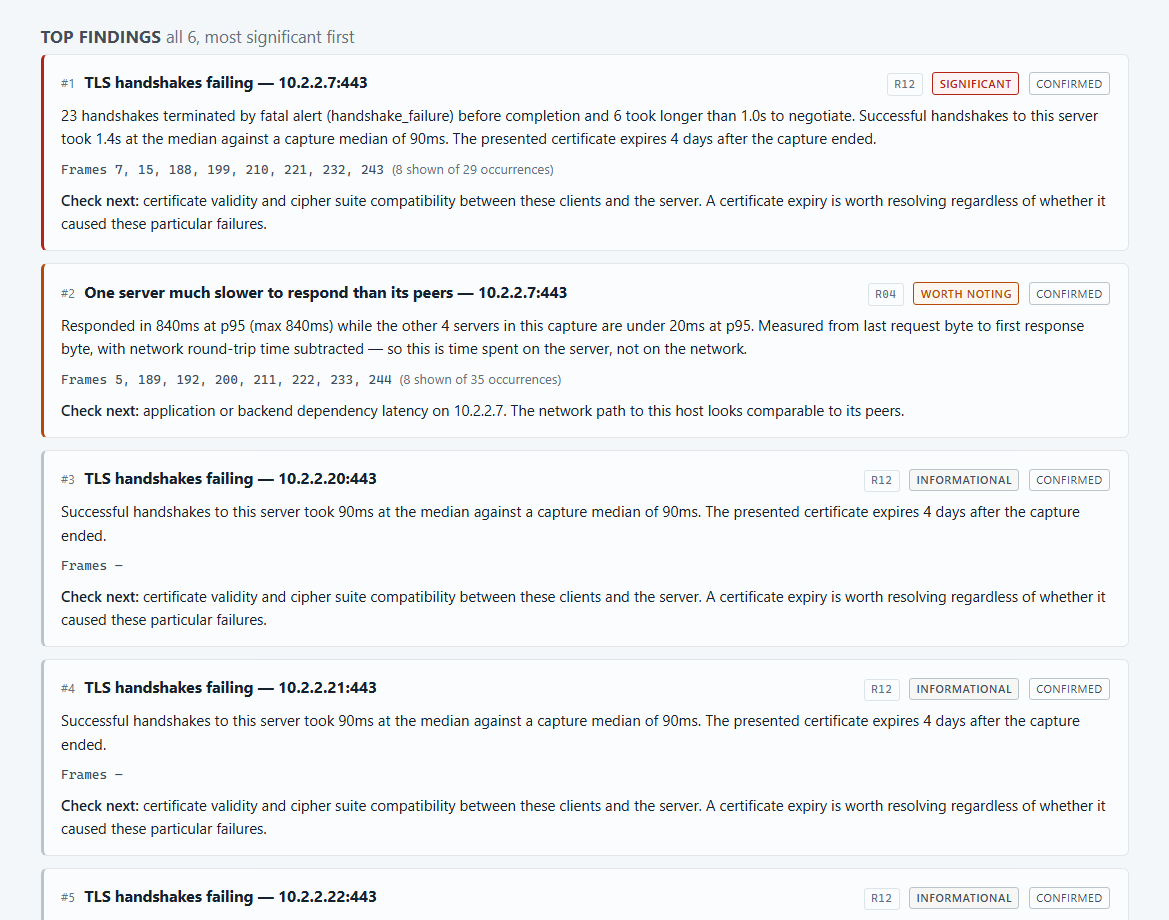
Point it at a .pcap and it runs fifteen deterministic checks, in plain English, with the frame numbers that show each one. It tells you what stood out. The diagnosis stays yours.
Nothing is asserted without the evidence beside it. If you disagree with a finding, the capture is right there to check it against — and the rule that produced it is published.
The measurement itself, with the numbers it was taken from — not a summary of them.
The comparison that made it unusual: a threshold, a peer group, or the capture's own median.
Frame numbers you can paste straight into Wireshark's display filter.
The next question the evidence supports — never a conclusion it doesn't.
Observed. Application response time p50 410 ms, p95 1.82 s, max 4.10 s across 61 requests.
Why it stood out. Forty-one other servers in this capture are under 40 ms at p95. This one is 45× the capture median, and network RTT to it is 11 ms — so the delay is above the network, not in it.
What to check next. Whether the slow responses cluster in time or in request path. Both are visible in the capture; neither is assumed here.
Illustrative finding, formatted as the app renders it. Severity colour is reserved for severity — it is never used as a brand colour.
Open a capture, read what stood out, and export the result as a single self-contained file you can attach to a ticket. These are captures of a synthetic test file, so every address in them is from a documentation range.
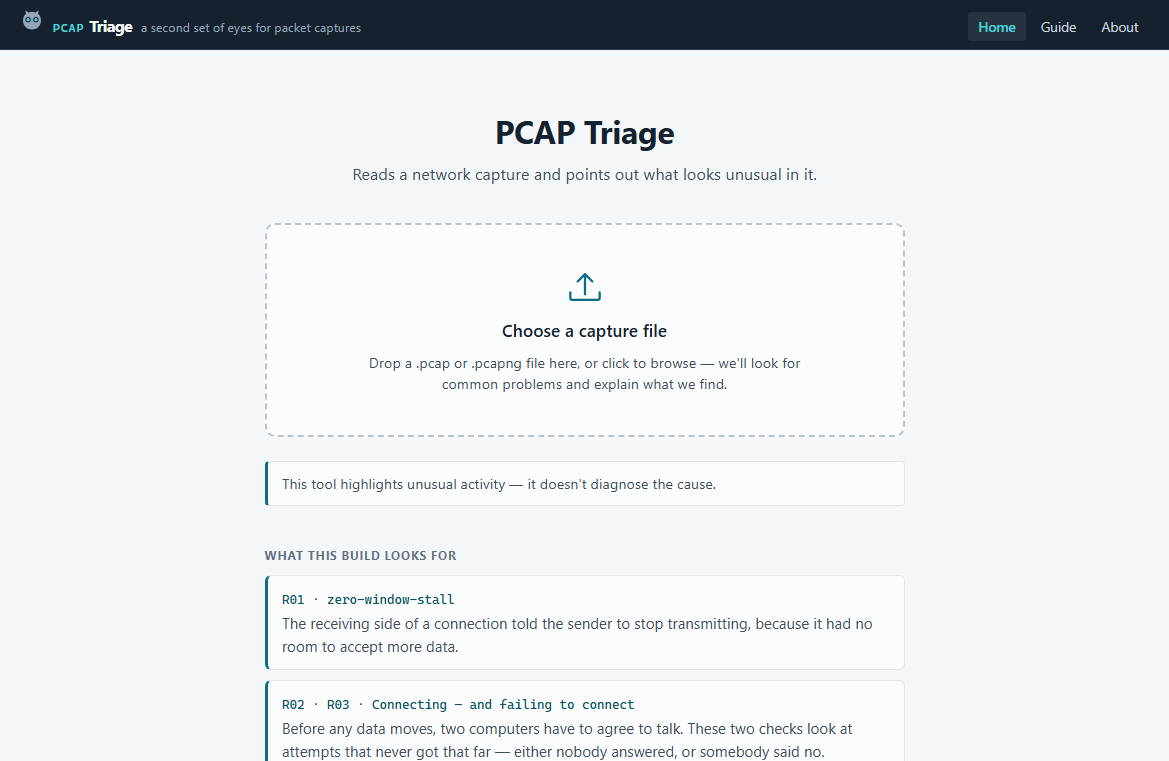
These cover the conditions behind most "the network is slow" reports. Each one's thresholds, scoring weight and reasoning are published in RULES.md, so you can audit why something surfaced — and disagree with it.
A peer advertised a zero window after a non-zero one, blocking the sender until it reopened.
A connection attempt with no SYN/ACK and no refusal, retry pattern included.
The SYN came back as a RST rather than a handshake. Instant, so it costs no time — just access.
Application response time, network RTT subtracted, measured at p95 against every peer in the capture.
Recovery after a timeout rather than duplicate ACKs — the expensive kind of loss.
Loss the sender recovered from quickly, rated against this capture's own median rather than a fixed number.
Segments that arrived early-numbered but fast enough that reordering explains them. Runs first, so loss isn't overcounted.
Retransmissions running five times heavier one way than the other on the same flow.
A RST with data still in flight — distinct from a tidy close and from an idle timeout.
Round-trip time four times the capture-wide median, with the spread reported so distance and congestion stay distinguishable.
Cleartext DNS with no answer inside two seconds, SERVFAIL or NXDOMAIN, or answers past 500 ms.
Fatal alerts, negotiation failures, handshakes over a second, and certificate dates where they're readable.
ICMP fragmentation-needed tied to a flow, or large segments retransmitting while small ones sail through.
Fifty-plus connections to one server:port with a median lifetime under a second.
Most of these are the reason to trust the rest.
A finding says this server responded in 1.8 s at p95 while 41 others are under 40 ms — never this server is the problem. The first is checkable. The second is a guess wearing a lab coat.
It means these fifteen checks found nothing. Plenty can be wrong that none of them look for, and the report says so every time rather than letting silence read as an all-clear.
DNS-over-TLS and TLS 1.3 handshakes with encrypted certificates are reported as not assessed rather than as fine.
Whether the ranking puts the right thing first is the single most useful thing you can send back.
A tool that hedges everything is useless. A tool that overclaims is worse. The whole design is an argument about where that line sits — which is also why the detection logic is published rather than described.
The file you point it at is opened read-only and left exactly as it was found.
No update check, no telemetry, no reverse DNS. Nothing leaves the machine, including on first run.
The file is opened read-only. Reports are written where you ask for them and nowhere else.
All detection is deterministic rule-based logic. The same capture produces the same findings, on any machine, forever.
The detection and ranking logic is published in full. You don't have to take the claims on trust — you can read them.
Put it wherever you like and run it.
Download pcaptriage-gui.exe from the releases page.
Run it. There is nothing to install and nothing to configure.
Drop a .pcap or .pcapng onto the window, or use Choose a capture.
The binary isn't code-signed, so SmartScreen shows "Windows protected your PC" with an unknown publisher. That's expected, not a sign anything is wrong — signing certificates cost money annually and this is a free tool. Click More info → Run anyway. If you'd rather not trust a binary from a stranger, the source builds in one command.